5.20241.9
5.20241.9
チャート:ウォータフォール
wijmo.chart.analyticsモジュールには、Seriesクラスを拡張して、近似曲線、移動平均、誤差範囲、箱プロット、ウォータフォールプロット、関数プロットなど、データに関する追加情報を提供するクラスが含まれます。
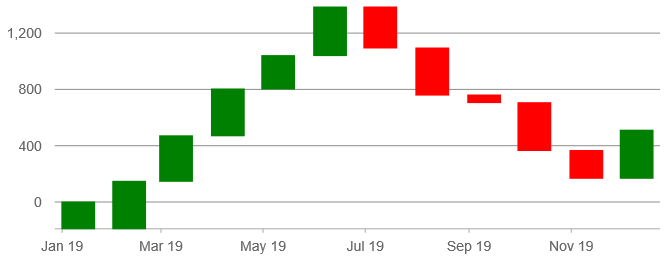
ウォータフォールチャートは、順次取り込まれる正または負の値の累積的な影響を把握するために役立ちます。開始位置からの増加または減少の様子を一連の変化量によって表示します。ウォータフォールチャートは、列が宙に浮いているように見えることから、「空飛ぶレンガ」チャートまたはマリオチャートとも呼ばれます。
ウォータフォールチャートを作成するには、次の手順に従います。
- Waterfall系列オブジェクトを作成します。
- nameプロパティとbindingプロパティを設定してWaterfall系列を構成します。
- start、total、falling、risingなど、さまざまなウォータフォール要素のスタイルを設定します。
例:
import * as chart from '@mescius/wijmo.chart';
import * as analytics from '@mescius/wijmo.chart.analytics';

// 「売上」のWaterfall系列を作成してチャートに追加します
var sales = new analytics.Waterfall();
sales.name = '売上';
sales.binding = 'sales';
sales.styles = {
    start: { fill: 'blue', stroke: 'blue' },
    total: { fill: 'yellow', stroke: 'yellow' },
    falling: { fill: 'red', stroke: 'red' },
    rising: { fill: 'green', stroke: 'green' }
};
myChart.series.push(sales);
その他のウォータフォールオプション
Waterfallクラスには、スタイルのカスタマイズのほかにも設定できるオプションがあります。
- connectingLines:接続線を表示するかどうかを決定します。
- intermediateTotalLabels:小計バーのラベルを含みます。配列または文字列である必要があります。
- intermediateTotalPositions:小計バーの位置のインデックスを含みます。
- relativeData:特定のデータが絶対値と相対値(差)のどちらを表すかどうかを決定します。
- showIntermediateTotal:小計バーを表示するかどうかを決定します。
- showTotal:チャートの最後に合計バーを表示するかどうかを決定します。
- start:開始バーの値。開始値がnullの場合、開始バーは表示されません。
- startLabel:開始バーのラベル。
- totalLabel:合計バーのラベル。
ウォータフォールのスタイル
以下のスタイルがサポートされています。
- start:開始バーのスタイルを指定します。
- total:合計バーのスタイルを指定します。
- intermediateTotal:小計バーのスタイルを指定します。
- falling:減少バーのスタイルを指定します。
- rising:増加バーのスタイルを指定します。
- connectorLines:connectorLinesのスタイルを指定します。
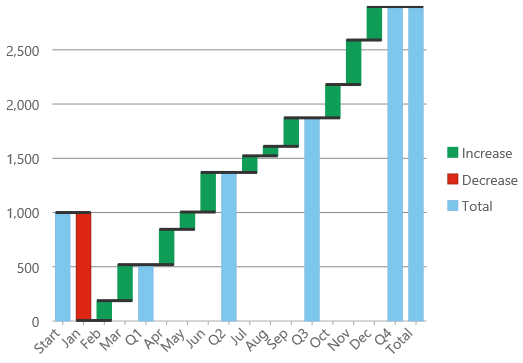
完全な例:
import * as chart from '@mescius/wijmo.chart';
import * as analytics from '@mescius/wijmo.chart.analytics';

// すべてのオプションを使用してウォータフォール系列を作成します
var waterfall = new analytics.Waterfall({
    relativeData: true,
    connectorLines: true,
    showTotal: true,
    start: 1000,
    showIntermediateTotal: true,
    intermediateTotalPositions: [3, 6, 9, 12],
    intermediateTotalLabels: ['Q1', 'Q2', 'Q3', 'Q4'],
    name: '増加,減少,合計',
    styles: {
        connectorLines: {
            stroke: '#333',
            strokeWidth: 3
        },
        start: {
            fill: '#7dc7ed'
        },
        falling: {
            fill: '#dd2714',
            stroke: '#a52714'
        },
        rising: {
            fill: '#0f9d58',
            stroke: '#0f9d58'
        },
        intermediateTotal: {
            fill: '#7dc7ed'
        },
        total: {
            fill: '#7dc7ed'
        }
    }
});
myChart.series.push(waterfall);
ウォータフォール系列のオプションの表示
Waterfall系列は、FlexChartの系列の1つとしてサポートされます。visibilityプロパティを次のいずれかに設定して、このウォータフォール系列を凡例に表示するかどうかを選択できます。
- Visible:系列はプロット領域内と凡例内に表示されます。
- Plot:系列はプロット領域内にのみ表示されます。
- Legend:系列は凡例内にのみ表示されます。
- Hidden:系列は非表示です。
凡例テキストは、ウォータフォール系列のnameプロパティを使用して設定されます。