5.20241.9
5.20241.9
チャート:注釈
注釈は、チャート上の注目すべきポイントや領域を強調表示するために使用されます。注釈は、画像、図形、テキストなどの任意の要素をチャート上に配置するためにも使用できます。FlexChartコントロールは、四角形、正方形、円、楕円、線、多角形、画像、テキストなどのさまざまな注釈をサポートします。
注釈は、特定のデータポイントや、データまたはページ座標内の任意のポイントにアタッチすることができます。
FlexChartに注釈を追加するには、次の手順に従います。
- チャートにアタッチするAnnotationLayerを作成します。
- このレイヤに楕円、四角形、画像、テキストなどの注釈オブジェクトを設定します。
- 各注釈のattachmentプロパティを設定して、注釈をどのようにチャートにアタッチするかを決定します。
- 注釈がポイントにアタッチされる場合は、注釈にpointIndexやseriesIndexなどの追加プロパティを設定します。
例:
import * as wjChart from '@mescius/wijmo.chart';
import * as wjAnnotation from '@mescius/wijmo.chart.annotation';

// 注釈レイヤを追加します
var annotations = new wjAnnotation.AnnotationLayer(myChart);
// データポイント5に楕円注釈をアタッチします
annotations.items.push({
    type: 'Ellipse',
    content: 'Ellipse',
    tooltip: '円の注釈です。',
    attachment: 'DataIndex',
    seriesIndex: 0,
    pointIndex: 5,
    width: 100,
    height: 40,
    position: 'Top',
    style: {
        fill: 'green',
        stroke: 'darkgreen',
        strokeWidth: 2,
        opacity: .25
    }
});
注釈コレクションをAnnotationLayerコンストラクタにパラメータとして渡すこともできます。
注釈タイプ
FlexChartは、次の組み込みタイプの注釈をサポートします。
- Circle:円注釈を表します。radiusプロパティを設定して、サイズを設定します。
- Ellipse:楕円注釈を表します。heightとwidthの各プロパティを設定して、サイズを設定します。
- Image:画像注釈を表します。href、height、widthの各プロパティを設定して、画像を設定します。
- Line:線注釈を表します。endおよびstartの各ポイントプロパティを設定して、線を設定します。
- Polygon:多角形注釈を表します。pointsプロパティを設定して、多角形を設定します。
- Rectangle:四角形注釈を表します。heightとwidthの各プロパティを設定して、サイズを設定します。
- Square:正方形注釈を表します。lengthプロパティを設定して、サイズを設定します。
- Text:テキスト注釈を表します。textプロパティを設定して、テキストを設定します。
線注釈の例:
// 1月31日から2月27日までの近似曲線を表示します
annotations.items.push({
    type: 'Line',
    tooltip: '線の注釈です。',
    position: 'Center',
    attachment: 'DataCoordinate',
    start: { x: new Date(2017, 0, 31), y: 810 },
    end: { x: new Date(2017, 1, 28), y: 840 },
    style: {
        stroke: 'darkgreen',
        strokeWidth: 4,
        opacity: .5
    }
});
画像注釈の例:
// マップマーカー画像を表示します
annotations.items.push({
    type: 'Image',
    href: 'https://maps.google.com/mapfiles/marker_green.png',
    width: 15,
    height: 30,
    attachment: 'DataCoordinate',
    point: { x: new Date(2017, 1, 7), y: 800},
    tooltip: '買い時',
});
すべての注釈には、次の共通プロパティがあります。
- attachment:アタッチの方法。詳細については、次のトピックを参照してください。
- isVisible:注釈の可視性(true/false)。
- name:注釈の名前。
- offset:アタッチポイントからの注釈のオフセット(ポイント)。
- point:アタッチ方法がDataCoordinateまたはAbsoluteの場合の注釈の座標。
- pointIndex:データポイントインデックス。attachmentプロパティがDataIndexに設定されている場合にのみ適用されます。
- position:アタッチポイントに対する注釈の位置(Center/Top/Bottom/Left/Right)。
- seriesIndex:注釈のデータ系列インデックス。attachmentプロパティがDataIndexに設定されている場合にのみ適用されます。
- style:fill、stroke、strokeWidthなどのSVGスタイル設定属性を指定するスタイルプロパティ。
- tooltip:注釈のツールチップ文字列。
注釈のアタッチ
FlexChartの注釈は、次のアタッチ方法をサポートしています。
- DataIndex:注釈ポイントの座標は、データ系列インデックスとデータポイントインデックスで定義されます。
- DataCoordinate:注釈ポイントは、データ座標で指定されます。
- Relative:注釈ポイントは、コントロール内の相対位置で指定されます。(0,0)が左上隅、(1,1)が右下隅になります。
- Absolute:注釈ポイントは、コントロールのピクセル座標で指定されます。
注釈をデータポイントにアタッチする
注釈を特定のデータポイントにアタッチするには、次の手順に従います。
- attachmentプロパティをDataIndexに設定します。
- アタッチされている系列のインデックスにseriesIndexを設定します。チャートに系列が1つしかない場合は、この値を0に設定する必要があります。
- アタッチされている系列内のデータポイントのインデックスをpointIndexに設定します。
- その他のプロパティを使用して外観を設定します。
例:
// 最初の系列の5番目のデータポイントに注釈をアタッチします
annotations.items.push({
    type: 'Text',
    attachment: 'DataIndex',
    seriesIndex: 0,
    pointIndex: 5,
    text: 'テキスト'
});
データ座標に基づく注釈の付加
プロット座標系の任意の場所に注釈をアタッチするには、次の手順に従います。
- attachmentプロパティをDataCoordinateに設定します。
- pointをプロット座標に設定します。
- その他のプロパティを使用して外観を設定します。
例:
// 注釈をx: 10, y: 80の位置にアタッチします
annotations.items.push({
    type: 'Text',
    attachment: 'DataCoordinate',
    point: { x: 10, y: 80},
    text: 'テキスト'
});
四角形注釈を使用してゾーンを作成する
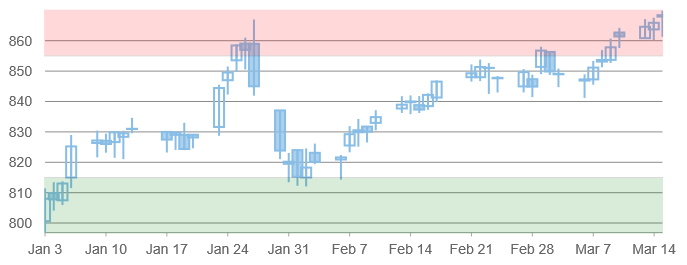
注釈を使用して、チャートに「ゾーン」を作成できます。ゾーンは、データポイントの背後にプロット領域を色分けして示し、値の範囲を強調表示するために使用されます。
たとえば、次のチャートでは、「買い」ゾーンと「売り」ゾーンが緑色と赤色の四角形注釈で表されています。
// 2つの四角形注釈を含む注釈レイヤを追加します
var annotations = new wjAnnotation.AnnotationLayer(myChart, [
    {
        type: 'Rectangle',
        attachment: 'DataCoordinate',
        point: { x: new Date(2017, 0, 1), y: 855},
        position: 1, // Center Top Bottom Left Right
        width: 20000, height: 20000,
        style: { fill: 'red', opacity: .15 }
    },
    {
        type: 'Rectangle',
        attachment: 'DataCoordinate',
        point: { x: new Date(2017, 0, 1), y: 815},
        position: 2, // Center Top Bottom Left Right
        width: 20000, height: 20000,
        style: { fill: 'green', opacity: .15 }
    }
]);
アタッチ方法DataCoordinateと共に多角形注釈を使用して、すべての辺をプロット連結ポイントで構成したゾーンを作成できます。次の例は、絶対位置を指定した多角形注釈を示しています。
// 多角形注釈を含む注釈レイヤを追加します
var annotations = new wjAnnotation.AnnotationLayer(myChart, [
    {
        type: "Polygon",
        content: "多角形",
        position: 0,
        style: {
            fill: "#FE2E2E",
            stroke: "#01A9DB",
            fill-opacity: 2,
            stroke-width: 4,
            stroke-opacity: 1
        },
        points: [
            { "x": 200, "y": 0 },
            { "x": 150, "y": 50 },
            { "x": 175, "y": 100 },
            { "x": 225, "y": 100 },
            { "x": 250, "y": 50 }
        ]
    }
]);